 ← Back
Deploy Uptime Kuma with Docker Compose and monitor your websites, APIs, and Docker containers in minutes. Get instant alerts via Telegram, email, or Slack when anything goes down — and publish a public status page for your users.
You deploy your blog, your password manager, your VPN — and then what? You assume it's all running fine until someone tells you it's down. Maybe that someone is a reader. Maybe it's you, three hours later, wondering why your site feels slow.
Uptime Kuma fixes this. It's a self-hosted monitoring tool that checks your services on a schedule and alerts you the moment something goes down. I run it at status.byte-guard.net to monitor every service in my stack. This Uptime Kuma setup guide walks you through installation, configuring monitors, setting up notifications, and creating a public status page.
If you run anything on a server, you need monitoring. Here's how to set it up in under 10 minutes.
What Do You Need to Run Uptime Kuma with Docker?
- A Linux VPS with Docker and Docker Compose (here's how I set mine up)
- A reverse proxy for SSL (Nginx Proxy Manager, Caddy, or Traefik)
- At least one service to monitor (your blog, an API, anything)
How Do You Deploy Uptime Kuma with Docker Compose?
Create a directory:
sudo mkdir -p /opt/uptime-kuma
cd /opt/uptime-kuma
Create the compose file:
# docker-compose.yml
services:
  uptime-kuma:
    image: louislam/uptime-kuma:1
    container_name: uptime-kuma
    volumes:
      - kuma_data:/app/data
    ports:
      - "127.0.0.1:3001:3001"
    restart: unless-stopped

volumes:
  kuma_data:
Start it:
docker compose up -d
The container binds to 127.0.0.1:3001 — accessible only from localhost. Your reverse proxy handles the public-facing SSL.
Set Up the Reverse Proxy
In Nginx Proxy Manager, add a proxy host: - Domain: status.yourdomain.com - Forward hostname: uptime-kuma (or 127.0.0.1) - Forward port: 3001 - SSL: enable, request Let's Encrypt certificate - WebSocket support: enable (required for real-time updates)
In Caddy, add to your Caddyfile:
status.yourdomain.com {
    reverse_proxy uptime-kuma:3001
}
Open https://status.yourdomain.com and create your admin account. Do this immediately — the first person to visit creates the admin account.
How Do You Add Your First Uptime Monitors?
Click "Add New Monitor" in the dashboard. Uptime Kuma supports many monitor types:
HTTP(s) Monitor
The most common type. It checks a URL and verifies the response code.
- Monitor Type: HTTP(s)
- URL:
https://blog.byte-guard.net - Heartbeat Interval: 60 seconds
- Retries: 3 (avoids false positives from temporary network blips)
- Accepted Status Codes: 200-299
This checks your blog every 60 seconds. If it returns a non-2xx status code 3 times in a row, it's marked as down.
TCP Port Monitor
Checks if a specific port is open. Useful for databases, mail servers, or any service that doesn't serve HTTP.
- Monitor Type: TCP Port
- Hostname:
127.0.0.1 - Port:
3306(MySQL) or5432(PostgreSQL) - Heartbeat Interval: 120 seconds
Ping Monitor
Simple ICMP ping. Checks if a host is reachable.
- Monitor Type: Ping
- Hostname:
10.0.0.1 - Heartbeat Interval: 60 seconds
Docker Container Monitor
Checks if a Docker container is running. Requires mounting the Docker socket.
Update your compose file to mount the socket:
services:
  uptime-kuma:
    image: louislam/uptime-kuma:1
    container_name: uptime-kuma
    volumes:
      - kuma_data:/app/data
      - /var/run/docker.sock:/var/run/docker.sock:ro
    ports:
      - "127.0.0.1:3001:3001"
    restart: unless-stopped
Security note: Mounting the Docker socket gives Uptime Kuma read access to all your containers. Mount it read-only (:ro) and be aware of the Docker security implications. If this concerns you, use HTTP monitors instead — they verify the service is actually responding, not just that the container is running.Restart and add a Docker container monitor: - Monitor Type: Docker Container - Container Name: ghost
What Does a Real-World Uptime Kuma Monitor Setup Look Like?
Here's what I actually monitor:
| Service | Monitor Type | Interval | URL/Target |
|---|---|---|---|
| Blog | HTTP(s) | 60s | https://blog.byte-guard.net |
| Status page | HTTP(s) | 60s | https://status.byte-guard.net |
| Ghost Admin | HTTP(s) | 120s | https://blog.byte-guard.net/ghost/ |
| NPM Dashboard | HTTP(s) | 120s | Internal IP:81 |
| SSH | TCP Port | 120s | Server IP, port 22 |
| VPS Ping | Ping | 60s | Server IP |
Six monitors, all running on the same VPS they're monitoring. Yes, if the VPS goes down, Uptime Kuma goes down too — it can't alert you. For critical infrastructure, you'd run Uptime Kuma on a separate server. For a blog, this is fine. I'd know from the DNS monitoring on my other setup.
How Do You Configure Uptime Kuma Notifications?
Monitoring without alerts is a dashboard you never check. Set up notifications so you know the moment something breaks.
Go to Settings → Notifications and click "Setup Notification."
Discord Webhook
- In your Discord server, go to channel settings → Integrations → Webhooks
- Create a webhook, copy the URL
- In Uptime Kuma: Notification Type → Discord, paste the webhook URL
- Test and save
Telegram Bot
- Message
@BotFatheron Telegram, create a bot, get the token - Get your Chat ID by messaging
@userinfobot - In Uptime Kuma: Notification Type → Telegram, enter bot token and chat ID
- Test and save
Email (SMTP)
- SMTP Host: your mail server (e.g.,
smtp.gmail.com) - SMTP Port: 587
- From/To: your email addresses
- Username/Password: your SMTP credentials
Apply Notifications to Monitors
After creating a notification channel, edit each monitor and check the notification methods you want. You can assign different notifications to different monitors — critical services get Telegram + Discord, less important ones get email only.
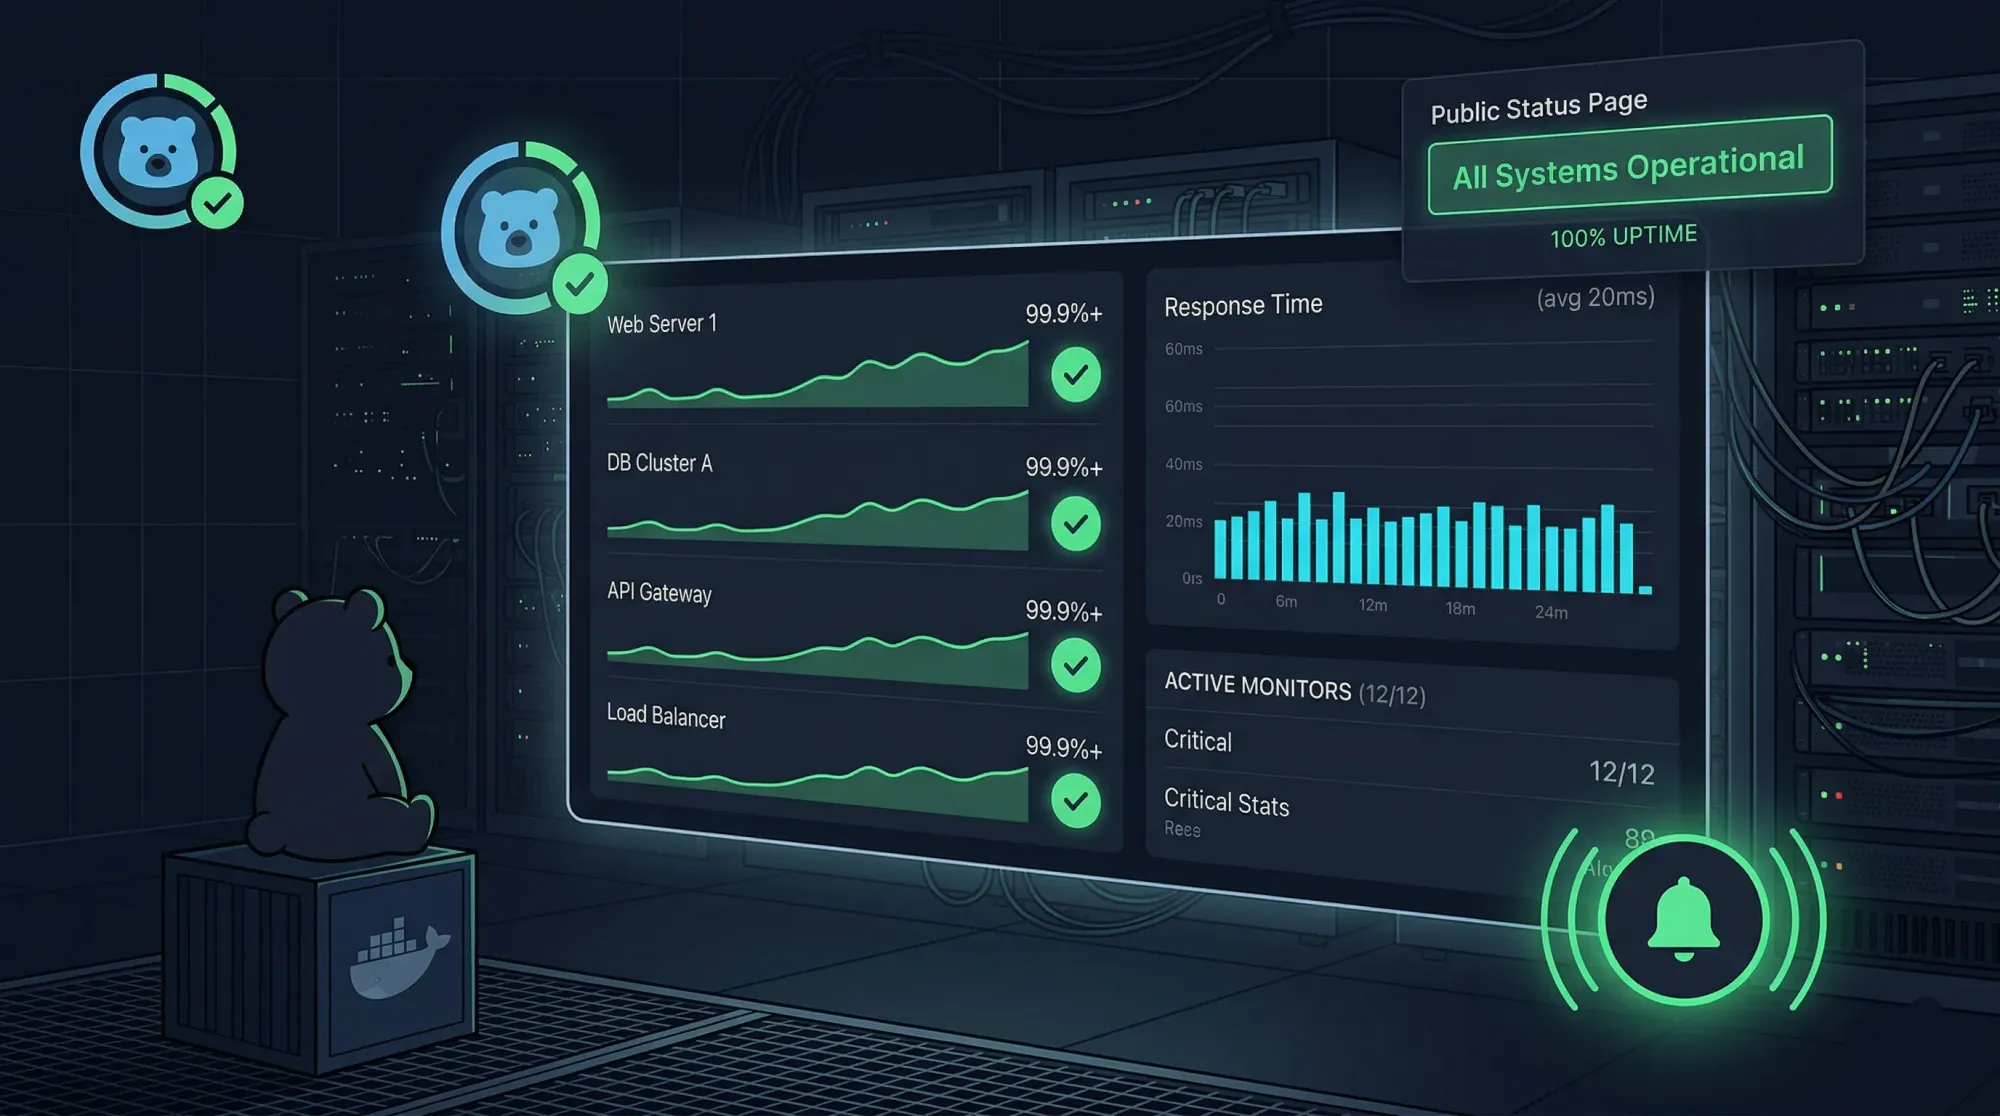
How Do You Create an Uptime Kuma Public Status Page?
This is one of Uptime Kuma's best features. A public page showing your service status — like status.byte-guard.net.
- Go to Status Pages in the sidebar
- Click "New Status Page"
- Set the title and slug (e.g., "ByteGuard Status" at
/status) - Add monitor groups — drag your monitors into sections
- Customize: description, footer text, and theme
- Save and publish
The status page shows: - Current status of each service (up/down/maintenance) - Uptime percentage over the last 90 days - Incident history - A heartbeat graph for each monitor
Maintenance Windows
When you're doing planned maintenance, create a maintenance window so your monitors don't fire false alerts:
- Go to Maintenance in the sidebar
- Create a new maintenance window with start/end times
- Select which monitors are affected
During the window, affected monitors show "Maintenance" instead of "Down" on the status page.
What Are Uptime Kuma’s Advanced Configuration Options?
Monitor Groups and Tags
Organize monitors with tags (e.g., "production", "staging", "internal") and group them on your status page. This keeps things manageable as your monitor count grows.
Upside-Down Mode
Inverts the monitor logic — alerts when a service comes up instead of going down. Useful for monitoring ports that should be closed or services that should be off.
Certificate Expiry Monitoring
HTTP(s) monitors automatically track SSL certificate expiry. You'll see the expiry date in the monitor details and get notified when it's approaching expiry (configurable threshold, default 30 days).
API and Integrations
Uptime Kuma has a push monitor type where your service sends heartbeats to Uptime Kuma instead of Kuma polling the service. Useful for cron jobs and batch processes:
# Add to the end of your cron script
curl -s "https://status.yourdomain.com/api/push/<PUSH_TOKEN>?status=up&msg=OK" > /dev/null
If the push doesn't arrive within the expected interval, the monitor marks as down.
How Do You Secure Your Uptime Kuma Instance?
- Authentication. Uptime Kuma requires login, but make sure you set a strong password. There's no 2FA built in — protect it with your reverse proxy (IP whitelist or HTTP basic auth on top).
- Docker socket. If mounted, it's read-only but still exposes container metadata. Consider whether HTTP monitors are sufficient for your needs.
- Status page visibility. Public status pages are just that — public. Don't include internal service names, IP addresses, or ports that you don't want exposed.
- Data retention. Monitor data grows over time. Uptime Kuma stores heartbeats in SQLite. For long-running instances, check the database size periodically:
docker exec uptime-kuma ls -lh /app/data/kuma.db.
How Do You Troubleshoot Uptime Kuma Issues?
Problem: Dashboard shows "WebSocket connection failed." Cause: Your reverse proxy isn't forwarding WebSocket connections. Fix: In NPM, enable "WebSocket Support" for the proxy host. In Nginx manually, add proxy_set_header Upgrade $http_upgrade; and proxy_set_header Connection "upgrade";.
Problem: Monitor shows "Down" but the service works fine in browser. Cause: The monitor is checking the wrong URL or port, or the service responds differently to non-browser requests. Fix: Verify the URL is exactly right (including https://). Check if the service requires specific headers — some apps return 403 without a proper User-Agent.
Problem: Notifications not sending. Cause: SMTP credentials wrong, Discord webhook expired, or Telegram bot token invalid. Fix: Use the "Test" button on each notification channel. Check Uptime Kuma logs: docker compose logs uptime-kuma.
Problem: Status page shows blank. Cause: No monitors assigned to the status page groups. Fix: Edit the status page, add groups, and drag monitors into them. Save and refresh.
Problem: High CPU usage. Cause: Too many monitors with very short intervals. Fix: Increase heartbeat intervals for non-critical monitors. 60 seconds is aggressive — 120-300 seconds is fine for most services.
Why Should You Self-Host Uptime Kuma Instead of Using a SaaS Service?
Uptime Kuma takes 10 minutes to set up and saves you from the embarrassment of finding out your site is down from a reader's complaint — or worse, not finding out at all.
I've been running it for the entire ByteGuard stack and it's caught two outages before anyone noticed. The public status page builds trust with readers, and the notification system is reliable across Discord, Telegram, and email.
For next steps:
- Follow Docker security best practices to lock down the container
- Set up Fail2Ban on your server for broader monitoring
- Check my original VPS setup guide if you're starting from scratch
If you need a VPS, I use Hetzner — their CPX22 handles all my services including Uptime Kuma with plenty of headroom.
Comments
Sign in with GitHub to comment. Threads live in the byteguard-comments repo.